Overview
Electrodermal Activity (EDA) has two components that are measured in microsiemens (µS): Tonic and phasic EDA that reflect different aspects of physiological arousal. Depending on your research goals, you would look into either of. Next to EDA, you can also look into valence, as arousal and valence are indicators of emotional experiences.
Tonic EDA – changes over a longer period of time:
- Definition: Tonic EDA, also known as Skin Conductance Level (SCL), represents the baseline level of skin conductance over a longer period of time. It reflects the overall state of arousal or alertness of an individual.
- Characteristics: It is a slow-moving, steady component and does not fluctuate quickly. Tonic EDA is influenced by general factors like the person’s overall stress level, emotional state, or the time of day. Therefore, try to account for as many variable as possible, but be aware that that is very difficult. This is essentially what makes EDA less popular.
- Usage outside games: Tonic EDA is often used to assess chronic stress or long-term changes in arousal. For example, a higher tonic EDA might indicate a person is generally more anxious or stressed over a prolonged period.
- Usage in games: Use tonic EDA to assess user experience or flow over a longer play session. Flow is a balance between high and low arousal. If you notice your players being stuck in a constant state of negative valence, and this is not intended, then you can derive that a change in flow is necessary.
Phasic EDA – rapid changes towards a stimuli:
- Definition: Phasic EDA, also known as Skin Conductance Response (SCR), represents rapid changes in skin conductance associated with discrete stimuli, such as a sudden noise or an emotionally charged image.
- Characteristics: Phasic EDA is a fast-changing component and reflects momentary increases in skin conductance, typically in response to specific events or stimuli. These responses are short-lived and return to the tonic level quickly after the stimulus has passed.
- Usage outside gaming: Phasic EDA is used to assess immediate responses to stimuli. For example, you can track phasic EDA to understand how a person reacts to stressors or emotional events in real-time.
- Usage in games: Use phasic EDA to assess player responses to finding certain objects (loot, quest markers, enemies) or assessing player journeys between different different paths of a game such as combat versus exploration moments to visualize the flow of a game.
Typical Values
Measure
- Skin conductance level (SCL)
- Change in SCL
- Frequency of NS-SCRs
- ER-SCR amplitude
- ER-SCR latency
- ER-SCR rise time
- ER-SCR half recovery time
- ER-SCR habituation (trial to habituation)
- ER-SCR habituation (slope)
Definition
- Tonic level of electrical conductivity of skin
- Gradual changes in SCL measured at two or more points in time
- Number of SCRs in absence of identifiable eliciting stimulus
- Phasic increase in conductance shortly following stimulus onset
- Temporal interval between stimulus onset and SCR initiation
- Temporal interval between SCR initiation and SCR
- Temporal interval between SCR peak and point of 50% recovery of SCR amplitude
- Number of stimulus presentations before two or three trials with no response
- Rate of change of ER-SCR amplitude
Typical Values
- 2-20 µS
- 1-3 µS
- 1-3 per min
- 0.2 – 1.0 µS
- 1-3 sec
- 1-3 sec
- 2-10 sec
- 2-8 stimulus presentations
- 0.01.0.05 µS per trail
Legend: Key: ER, event-related; NS, nonspecific; SCR, skin conductance response
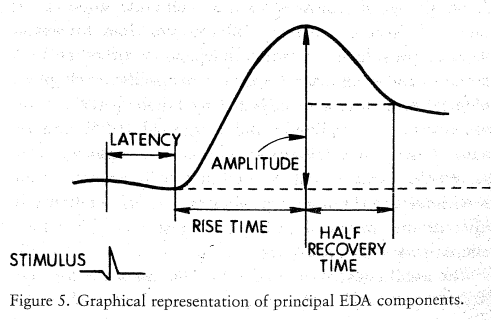
This table offers you an overview about values that could be relevant for analysis. As an additional visual aid, this is the anatomy of an EDA response.
Arousal and Valence – understanding emotional experiences
Additionally, if you are interested in specific emotions, you should then observe arousal with valence.
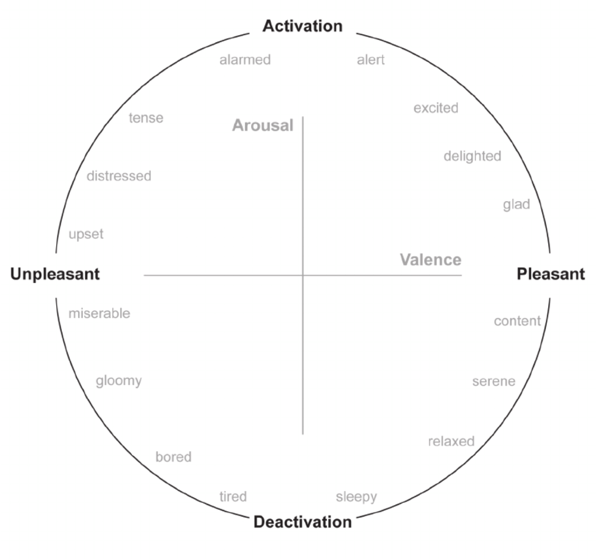
- Definition & Characteristics: Valence refers to the intrinsic attractiveness (positive valence) or averseness (negative valence) of an event, object, or situation. It is essentially the “pleasantness” or “unpleasantness” of an emotion. The arousal level “high” (activation) or “low” (deactivation) represents the intensity or energy level of the emotional experience.
- Usage: Its usage is universal and usually this matrix reproduced from the original paper by L. Feldman Barrett and J.A. Russell, 1998, Journal of Personality and Social Psychology, 74(4), p. 970 (Independence and bipolarity in the structure of current affect.) is how to visualize your results. Valence captures whether an emotion feels good or bad, while arousal captures how energetically it is felt. Together, they help define the nature and intensity of emotions, allowing for a more nuanced understanding of emotional experiences.
- Usage in games: Use a similar matrix, for example after an experiment, and let your players mark their felt emotional experience.
Analysis of EDA Signals
Depending on your resources, study goals, experience and time, there are different ways of analyzing EDA signals. Use the “Detailed Notes” row in the table below to read up on details about particular steps. All of the methods curated here can be performed in an excel sheet without complex equations with the exception of the CDA method requiring Python coding.
1 – Decomposition
- Depending if you are an advanced data genius, a beginner and resources available (time, tools), you can pick a method around that.
- The high-pass filtering method is one of the easiest ones to perform and is usually enough.
- In case you are looking into machine learning and prediction models, you might want to use the CDA method. This one will give you more reliable data but it requires higher expertise, more time and you should be able to code with Python most likely.
2 – Normalization: Choosing the Right Method
The choice of normalization method depends on your specific research question, data characteristics, and the need for comparison across subjects or conditions. For instance:
- Z-score normalization is common in psychophysiological studies.
- Baseline correction or percent change is preferred for event-related analysis.
- Min-max normalization is useful for machine learning or where a specific range is needed.
3 – Visualization: Share your findings
The most rewarding step is visualizing what you have found. The normalization process is already enough to generate valuable insights depending on your research goal. Regardless, here are some other examples:
- Plot the original EDA signal along with the separated tonic and phasic components to visually inspect the decomposition
- Calculate features like SCR amplitude, frequency, etc. to extract meaningful physiological metrics
- Plot the valence, arousal, tonic and phasic components to visualize emotions of a game flow
| Step | Method | Research goal | Researcher level | EDA Type |
| 1 – Decomposition | High-pass Filtering | Assess user experience or flow over a longer play session. | Beginner | Tonic |
| 1 – Decomposition | Continuous Decomposition Analysis (CDA) | Assessing long term or rapid stimuli responses | Advanced | Tonic, Phasic |
| 2 – Normalization | z-score | Compare data across different individuals or conditions | Beginner | Tonic, Phasic |
| 2 – Normalization | Min-Max Normalization | For machine learning applications. | Intermediate | Tonic, Phasic |
| 2 – Normalization | Baseline correction | Analyzing changes due to a stimulus or event | Beginner | Phasic |
| 2 – Normalization | Percentage changes | Comparing responses across individuals or conditions with different baseline levels. Alternative to “range changes”. | Beginner | Tonic |
| 2 – Normalization | Range changes | Alternative to “percentage changes”. Comparing responses across individuals or conditions with different baseline levels. | Beginner | Tonic |
Overview of methods and EDA type suggested depending on your research goals. See appendix below for detailed notes on how each method is being used.
Recommended Literature & Resources
Books, Articles & Tools
- “Electrodermal Activity” by Wolfram Boucsein (2012)
- “Handbook of Psychophysiology” by John T. Cacioppo, Louis G. Tassinary, and Gary G. Berntson (2017)
- Isbister, K., & Schaffer, N. (2008). Game Usability. Advice from the Experts for Advancing the Player Experience. Morgan Kaufmann, Burlington.
- Mandryk, R.L., Atkins, S.M., & Inkpen, K.M. (2006). A Continuous and Objective Evaluation of Emotional Experience with Interactive Play Environments. In Proceedings of the SIGCHI Conference on Human Factors in Computing Systems (Montréal, Québec, Canada) (CHI ’06). Association for Computing Machinery, New York, NY, USA, 1027–1036. https://doi.org/10.1145/1124772.1124926
- Benedek, M., & Kaernbach, C. (2010). “Decomposition of skin conductance data by means of nonnegative deconvolution.” Psychophysiology, 47(4), 647-658.
- Bach, D. R., Flandin, G., Friston, K. J., & Dolan, R. J. (2009). “Time-series analysis for rapid event-related skin conductance responses.” Journal of Neuroscience Methods, 184(2), 224-234.
- Dawson, M. E., Schell, A. M., & Filion, D. L. (2007). “The electrodermal system.” In J. T. Cacioppo, L. G. Tassinary, & G. G. Berntson (Eds.), Handbook of Psychophysiology (3rd ed.) https://doi.org/doi:10.1017/CBO9780511546396
- “NeuroKit2 Documentation” (GitHub) Link: Neurophysiological Data Analysis with NeuroKit2 — NeuroKit2 0.2.11 documentation (neuropsychology.github.io)
- “Ledalab Documentation”
Overview
- This is one of the most comprehensive texts on EDA. It covers the physiological basis, measurement techniques, data processing, and applications of EDA in various fields.
- This handbook offers a broad overview of psychophysiological measures, including EDA. It covers the theoretical background, data acquisition, preprocessing, and analytical techniques.
- This one is tailored towards the video games industry and offers you insights into a variety of methods, including psychophysiological ones. I recommend the first edition because it has better user cases.
- This paper presents a method of modeling user emotional state, based on a user’s physiology, for users interacting with play technologies.
- This paper introduces and explains the Continuous Decomposition Analysis (CDA) method for separating tonic and phasic components of EDA.
- Discusses methods for analyzing phasic EDA responses, particularly in event-related paradigms.
- This chapter provides a thorough overview of the electrodermal system, including measurement, analysis, and interpretation of EDA data.
- NeuroKit2 is an open-source Python package for biosignal processing. It provides tools for EDA preprocessing, decomposition, and analysis
- Ledalab is a MATLAB toolbox specifically for EDA analysis, with a focus on Continuous Decomposition Analysis.
Why read
- It provides detailed insights into EDA data processing and analysis methods, including tonic and phasic components, making it an essential resource.
- It’s a valuable resource for understanding how EDA fits into broader psychophysiological research.
- Useful overview about psychophysiological methods and data processing.
- How-to analyze data if you’re looking into emotional experience in video games.
- It’s essential for understanding advanced techniques in EDA signal processing.
- Offers insights into processing and analyzing fast-changing phasic components of EDA.
- It’s a concise source of foundational information on EDA in psychophysiological research.
- The documentation offers practical guides and code examples for working with EDA data using Python.
- Useful for those using MATLAB for EDA signal processing and analysis.
Appendix
| Method | Description | Step 1 | Step 2 | Step 3 | Step 4 |
| High-pass filtering | This simpler method involves applying a high-pass filter to the EDA signal to extract the phasic component and then subtracting this from the original signal to obtain the tonic component. | High-pass Filtering: Apply a high-pass filter (cutoff ~0.05-0.1 Hz) to the original EDA signal. The resulting signal represents the phasic component. | Tonic Component Extraction: Subtract the phasic component from the original EDA signal to isolate the tonic component. | Visualization: Plot the original EDA signal along with the separated tonic and phasic components to visually inspect the decomposition. | |
| Decomposition | This approach uses deconvolution techniques, where the EDA signal is modeled as a sum of overlapping phasic responses (Skin Conductance Responses or SCRs) superimposed on a tonic component. I personally have not used this method, as I did not have the experience to do so. In case you have a dedicated data analyst in your team, try out this method, as it seems to be more reliable. Tools: The cvxEDA algorithm, implemented in the Python package NeuroKit2 or Ledalab for MATLAB, is widely used for CDA-based decomposition. | Deconvolution: The EDA signal is deconvolved with a standard SCR function (often an impulse response model) to estimate the underlying phasic driver. | Separation: The tonic component is then extracted as the slow-moving baseline, and the phasic component is the sum of detected SCRs. | Reconstruction: The tonic and phasic signals are reconstructed from these components. | Visualization: Plot the original EDA signal along with the separated tonic and phasic components to visually inspect the decomposition. |
| Normalization | Converts the EDA data into z-scores by subtracting the mean and dividing by the standard deviation of the signal. This method centers the data around zero and scales it according to its variability. Useful when you need to compare data across different individuals or conditions, especially when there is a large inter-individual variability. | Z = X – μ / σ, where: X is the raw EDA value, μ is the mean of the EDA signal, σ is the standard deviation of the EDA signal. | |||
| Min-Max Normalization | Scales the EDA data to a fixed range, typically [0, 1], by subtracting the minimum value and dividing by the range (max – min). Ideal when you need the data to fit within a specific range, such as for machine learning applications. | X’ = X – Xmin / Xmax – Xmin, where: X is the raw EDA value, Xmin and Xmax are the minimum and maximum values in the EDA signal. | |||
| Baseline correction | Involves subtracting a baseline value (often the mean or median of a resting period) from the EDA signal. This method focuses on changes from a baseline rather than absolute values. Useful when analyzing changes due to a stimulus or event, rather than absolute levels of EDA. | Identify a baseline period (e.g., a resting state before stimulus presentation). | Subtract the average or median EDA value of this baseline period from the entire signal. | ||
| Percentage changes | Calculates the percentage change in EDA relative to a baseline period, which standardizes the response across individuals. Ideal for comparing responses across individuals or conditions with different baseline levels. | ‘Change = X-Xbaseline / Xbaseline x 100, where: Xbaseline is the mean EDA during a baseline period. | |||
| Range changes | Normalizes EDA data by dividing the raw signal by the range of values observed for each individual. Helps in comparing data across individuals with different absolute levels of EDA. | X’= X / Xmax-Xmin Where: X is the raw EDA value, Xmin and Xmax are the minimum and maximum values in the EDA signal. |
